
 Susie: 07972 263 676
How should we model infiltration?
The concepts of infiltration and air tightness in buildings are well recognised, but not necessarily accurately accounted for in dynamic thermal models (DTMs).
Infiltration is included in most, if not all, analysis models, but the methodologies used to establish and apply the rate of infiltration are often simplistic and subject to high levels of uncertainty due to the complex processes that underpin them.
In this blog we are going to look at what infiltration is, how it tends to be modelled and whether we might be able to do it better.

What is infiltration?
CIBSE TM23 (2022) defines infiltration as follows:
Infiltration: this refers to the uncontrolled fortuitous movement of air into (infiltration) or out of (exfiltration) a building envelope or component under natural conditions. It is due to the porosity of building fabric materials, interfaces between materials and components and imperfections in the construction of the building, and is caused by pressure difference effects between indoors and outdoors, themselves driven by temperature differences (the stack effect) and/or wind effects.
So, the movement of air through the building envelope is composed of a combination of pressure differences caused by wind (direction and speed), and temperature differences that lead to the stack effect.
- The wind pressure is easily imagined, with different pressures present at different locations on the façade due to the speed and direction of the wind.
- The stack effect is harder to visualise as it is based on differences in air density between inside and outside the building, which vary with height.
Figure 1 shows an example of typical pressure distributions due to these two effects.
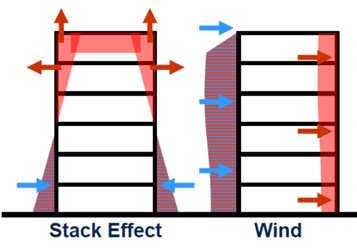
Figure 1: Adapted from Energy Education, University of Calgary
Levels of infiltration have reduced dramatically in recent decades as levels of airtightness in construction have improved. New buildings are pressure tested to ensure standards are met, and those built to the Passivhaus standard must be extremely airtight. Fabric heat loss has also reduced over the same time period, as allowable U-value limits have been improved, but the impact of infiltration is nevertheless a lesser factor in new buildings than in older existing buildings.
Why is infiltration relevant to dynamic thermal modelling?
Quite simply because air movement across a building envelope leads to heat loss and/or gain, transfer of airborne pollutants such as CO2, and an increase in room air movement, with related effects on thermal comfort. Therefore, the more accurate the modelling of infiltration is, the better our estimations of energy use, air quality and thermal comfort will be.
Current approach
Part of the challenge with modelling infiltration is the number of methodologies that exist for estimating infiltration and the variable levels of evidence underpinning them.
As a study undertaken by Loughborough University in 2021 showed, just in the context of domestic infiltration there were eleven different estimation methods used by previous academic studies. These delivered predicted infiltration rates between 64% and 208% higher than those measured empirically via tracer gas tests in a test house, indicating both a wide range of outcomes and a clear tendency towards overestimation during the summer period evaluated. The Loughborough University study was limited to domestic properties in summer months, but nevertheless gives a sense of the range of approaches available.
Some of the most commonly used approaches are as follows:
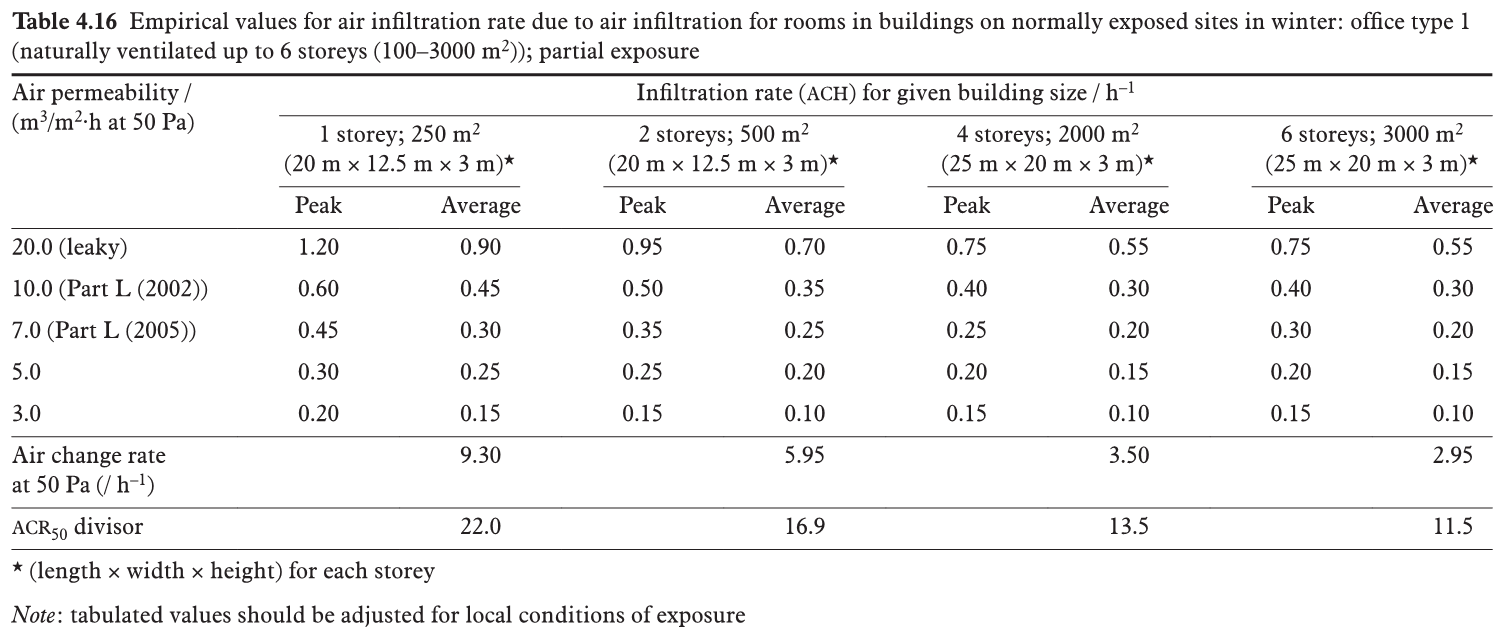
CIBSE Guide A – applying a constant air change rate (ach) based on empirical infiltration data from the tables (based on normally exposed sites in winter) in the guide – see Figure 2 for an example. These vary depending on the proposed air permeability rate and the building type.
SAP – this estimates infiltration based on the air permeability test result, making allowance for variable monthly wind speeds. There are two calculation routes:
- Using a fan pressurisation test results and the divide-by-20 rule of thumb (i.e. air permeability rate divided by 20 equals infiltration rate), a simplified approach that has been debated for decades. As TM23 highlights, in order for this rule of thumb to be applied it assumes a volume-to-envelope area ratio of 1 (a factor that varies significantly between buildings of different proportions) and should therefore “only be seen as an approximation for the purpose of space heating-focused calculations”. Modification factors can also be applied to take some account of sheltering.
- Alternatively, a pulse test result and infiltration rate calculated via an alternative formula (see SAP guidance) can be used.
‘Crack’ modelling – this approach involves estimation of the air flow through ‘cracks’ in the façade representing openings around windows, doors and other façade features. This method is rarer in domestic compliance modelling as it requires a dynamic simulation model in order to fully appreciate. It also isn’t permissible within non-domestic Part L regulatory checks as the National Calculation Methodology (NCM) requires a constant, uniform air change rate.
Outside of compliance modelling there is flexibility for modellers to use whichever infiltration approach they deem suitable. However, with limited data and guidance available, many modellers are hesitant to deviate from the recognised approaches used for compliance calculations. Infiltration is therefore often modelled as uniform throughout the whole building, rather than occurring principally at the external envelope and with different characteristics on the windward and leeward facades. It is also commonly modelled as a fixed rate rather than varying with external wind speed.
The purpose of a model and the time period modelled are also relevant, with infiltration rates for winter heat loss calculations being conservative at higher values, while those for summertime thermal comfort checks will be conservative at lower values.
While the simplifications used to model infiltration may be a pragmatic response to the complexity and multifaceted nature of calculating it accurately, the following question remains…
Can we do better?
The starting point here may be to consider some of the variables that are not fully, or only partially, accounted for in current practice:
Uniform rate vs. non-uniform rate
As mentioned, due to its inherent complexity, infiltration is often applied as a uniform whole building air changes per hour figure to all zones within a model.
However, as we have seen within the TM23 definition, stack and wind effects vary across a building, meaning that a uniform rate is a simplification of the dynamic effects taking place. The “crack” approach to modelling infiltration potentially offers some benefit in this regard, with small gaps in the envelope used to allow a network of airpaths through the building. These should be capable of better capturing the dynamic effects at play, such as changes in wind speed and direction.
Infiltration and exfiltration
Current practice tends to assume that buildings experience equal infiltration and exfiltration in every space. However, the reality is usually more complex than that. As a BRE research paper from 2019 outlines:
“Air infiltration occurs when air moves into a building or a zone within a building. Whilst air exfiltration occurs when air moves out of a building or zone.”
The paper goes on to note that:
“Once air infiltrates the building from the outside (via cracks or openings) it is important to understand how the air moves around the different zones and where it eventually goes to, since this will influence the mass transfer of heat throughout the building.”
The CIBSE definition of infiltration includes both air into (infiltration) or out of (exfiltration) a building. Therefore, we need to ensure that both sides of this definition are being considered and that different processes will be occurring at different locations within the building. The uniform ach method assumes the same amount of air enters and leaves each zone, whereas the entering and leaving often occur on opposite sides or different floors of a building.
Seasonality
It is important to recognise that infiltration is different between seasons. Infiltration is generally lower in summer due to lower average wind speeds and temperature differences being less pronounced.
Whereas in the past we were primarily interested in winter infiltration and the associated heat loss, the increased overheating risk in UK buildings means that we also need to consider infiltration in the context of summertime conditions.
There are other factors that impact on – or are impacted by – infiltration beyond those outlined above. However, we have highlighted those considered to be the most impactful.
Possible modelling approaches
In the case of compliance calculations, the approaches to infiltration are prescriptive and do not allow the assessor to stray from the predefined methodology. In more detailed energy or comfort studies, there is scope for the modeller to take a more nuanced approach.
Taking the example of EDSL’s Tas software – as this is a tool we use regularly – there are additional options for modelling infiltration:
The first option involves the setting of an infiltration coefficient, as illustrated in Figure 3 below.
This takes the baseline infiltration rate entered (in air changes per hour, rated at external wind speed of 3m/s) and extrapolates it up or down depending on external wind speed.
By default, the coefficient would be 1.0, which means that the infiltration remains constant. However, if this is changed to 0.5, for example, it varies the infiltration rate depending on external wind speed, with 50% of the baseline infiltration rate applied at 0m/s wind speed. This minimum value would therefore represent the proportion of infiltration attributable to the stack effect, with no wind driven infiltration present. A linear increase in the infiltration rate is applied, as indicated in Figure 3. This approach is possible in other software tools, but may require a workaround solution to replicate it.
Applying this arrangement allows some variation to be accounted for, though Inkling are not aware of any specific guidance on what the most appropriate figure is to use for the infiltration coefficient (i.e. the stack effect proportion) which will, in any case, constantly vary in real life.
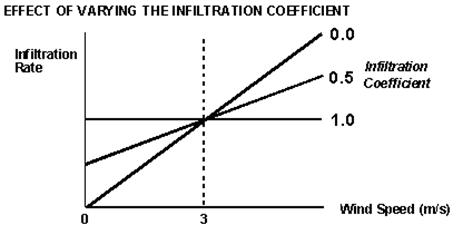
Figure 3: Infiltration Coefficient graph from the Tas Building Simulator Theory Manual
The second option is more involved option, and requires modelling cracks in the external envelope of the building. Crack apertures can either be calculated independently by the modeller, or EDSL have a crack calculation tool (NB: only currently available on request in beta version, though EDSL hope to include in a future release). This tool is based on the orifice flow law and calculates the average aperture factor that would need to be applied to the selected building elements (e.g. window frames or external walls) to give the entered pressure drop at the measured air permeability rate. In this scenario, small ‘crack’ apertures are created in the specified building element, giving a degree of air flow through the envelope.
It is hard to verify whether either of these methods are more or less representative of actual infiltration without further comparative studies being undertaken. However, they do acknowledge that infiltration is not a static process and look to take better account of the mechanisms that drive it. The tests Inkling have run suggest that the crack approach yields lower levels of air turnover than the equivalent uniform rates (based on using CIBSE Guide A rates) in the summer condition. This correlates with the findings of the Loughborough study, which found that all the modelling methods assessed overestimated against measured data.
Other DTM software packages also have similar options for modelling infiltration in a more detailed manner:
- IES Virtual Environment allows the modeller to include cracks within an analysis, with crack coefficient and length options applied to openings. Guidance is available on how to go about setting these parameters.
- DesignBuilder includes options for the modeller to either set specific flow coefficients and exponents through custom templates, or to apply pre-defined ‘crack templates’, with five pre-populated templates for buildings rated from “Very Poor” through to “Excellent”. Both custom and pre-defined templates can be loaded at any level from whole building down to surface level. The rating levels for the pre-defined templates are not quantified, so it is left up to the modeller to decide which is the most appropriate.
Both IES and DesignBuilder reference the crack equations in AIVC’s Numerical Database (Technical Note AIVC 44, March 1994).
Conclusion
Current methods for modelling infiltration are commonly overly simplistic and often do not represent real infiltration characteristics. However, the compound effects of multiple façade ‘cracks’ are hard to capture accurately, and the impact of this inaccuracy on results is reducing as new buildings become increasingly airtight.
In many modelling assessments, constant, uniform rates of infiltration are applied to all spaces in a building based on empirical data. This is an expedient though imperfect modelling method and responds to the absence of alternative data and guidance on the subject.
Many of the DTM software tools have alternative approaches available, allowing the modeller to include cracks within the envelope in an attempt to better capture variations in wind speed, direction and pressure differences. However, these methods are often software specific meaning that solutions are reliant on a modeller developing an approach for that given tool rather than using industry wide, software agnostic guidance on infiltration.
Numerous studies have highlighted the need for a more thorough, nuanced approach to modelling infiltration and this is something we would also support.
—
We would be interested to know how you model infiltration, and your thoughts on how industry practice could be improved. We would be keen to support any initiative to further research and develop software agnostic guidance on modelling infiltration in summer and winter for all building types.
—
 Posted by Marcus Haydon
- Posted in CIBSE, Publications, Research
 May, 01, 2025
 Comments Off on How should we model infiltration?

 Join Us On In.com